contest description /
ACT operates nearly 9,000 testing centers annually to deliver The ACT Assessment to over two million high school students on six different Saturdays each year as part of its open, “National” program.
Use of the test data by schools and government agencies has grown significantly in recent years. This growth is increasing the demands on the ACT network and test seat availability. Thus, ACT seeks to use data to carefully mange its system and its operating costs.
The 2016 challenge is to develop a visual representation of how changes in availability of an ACT product (i.e., an assessment test) in a geographic area or as part of a distribution network can affect nearby or adjacent distribution sites by moving students or assessments, changing dates, or some other strategy.
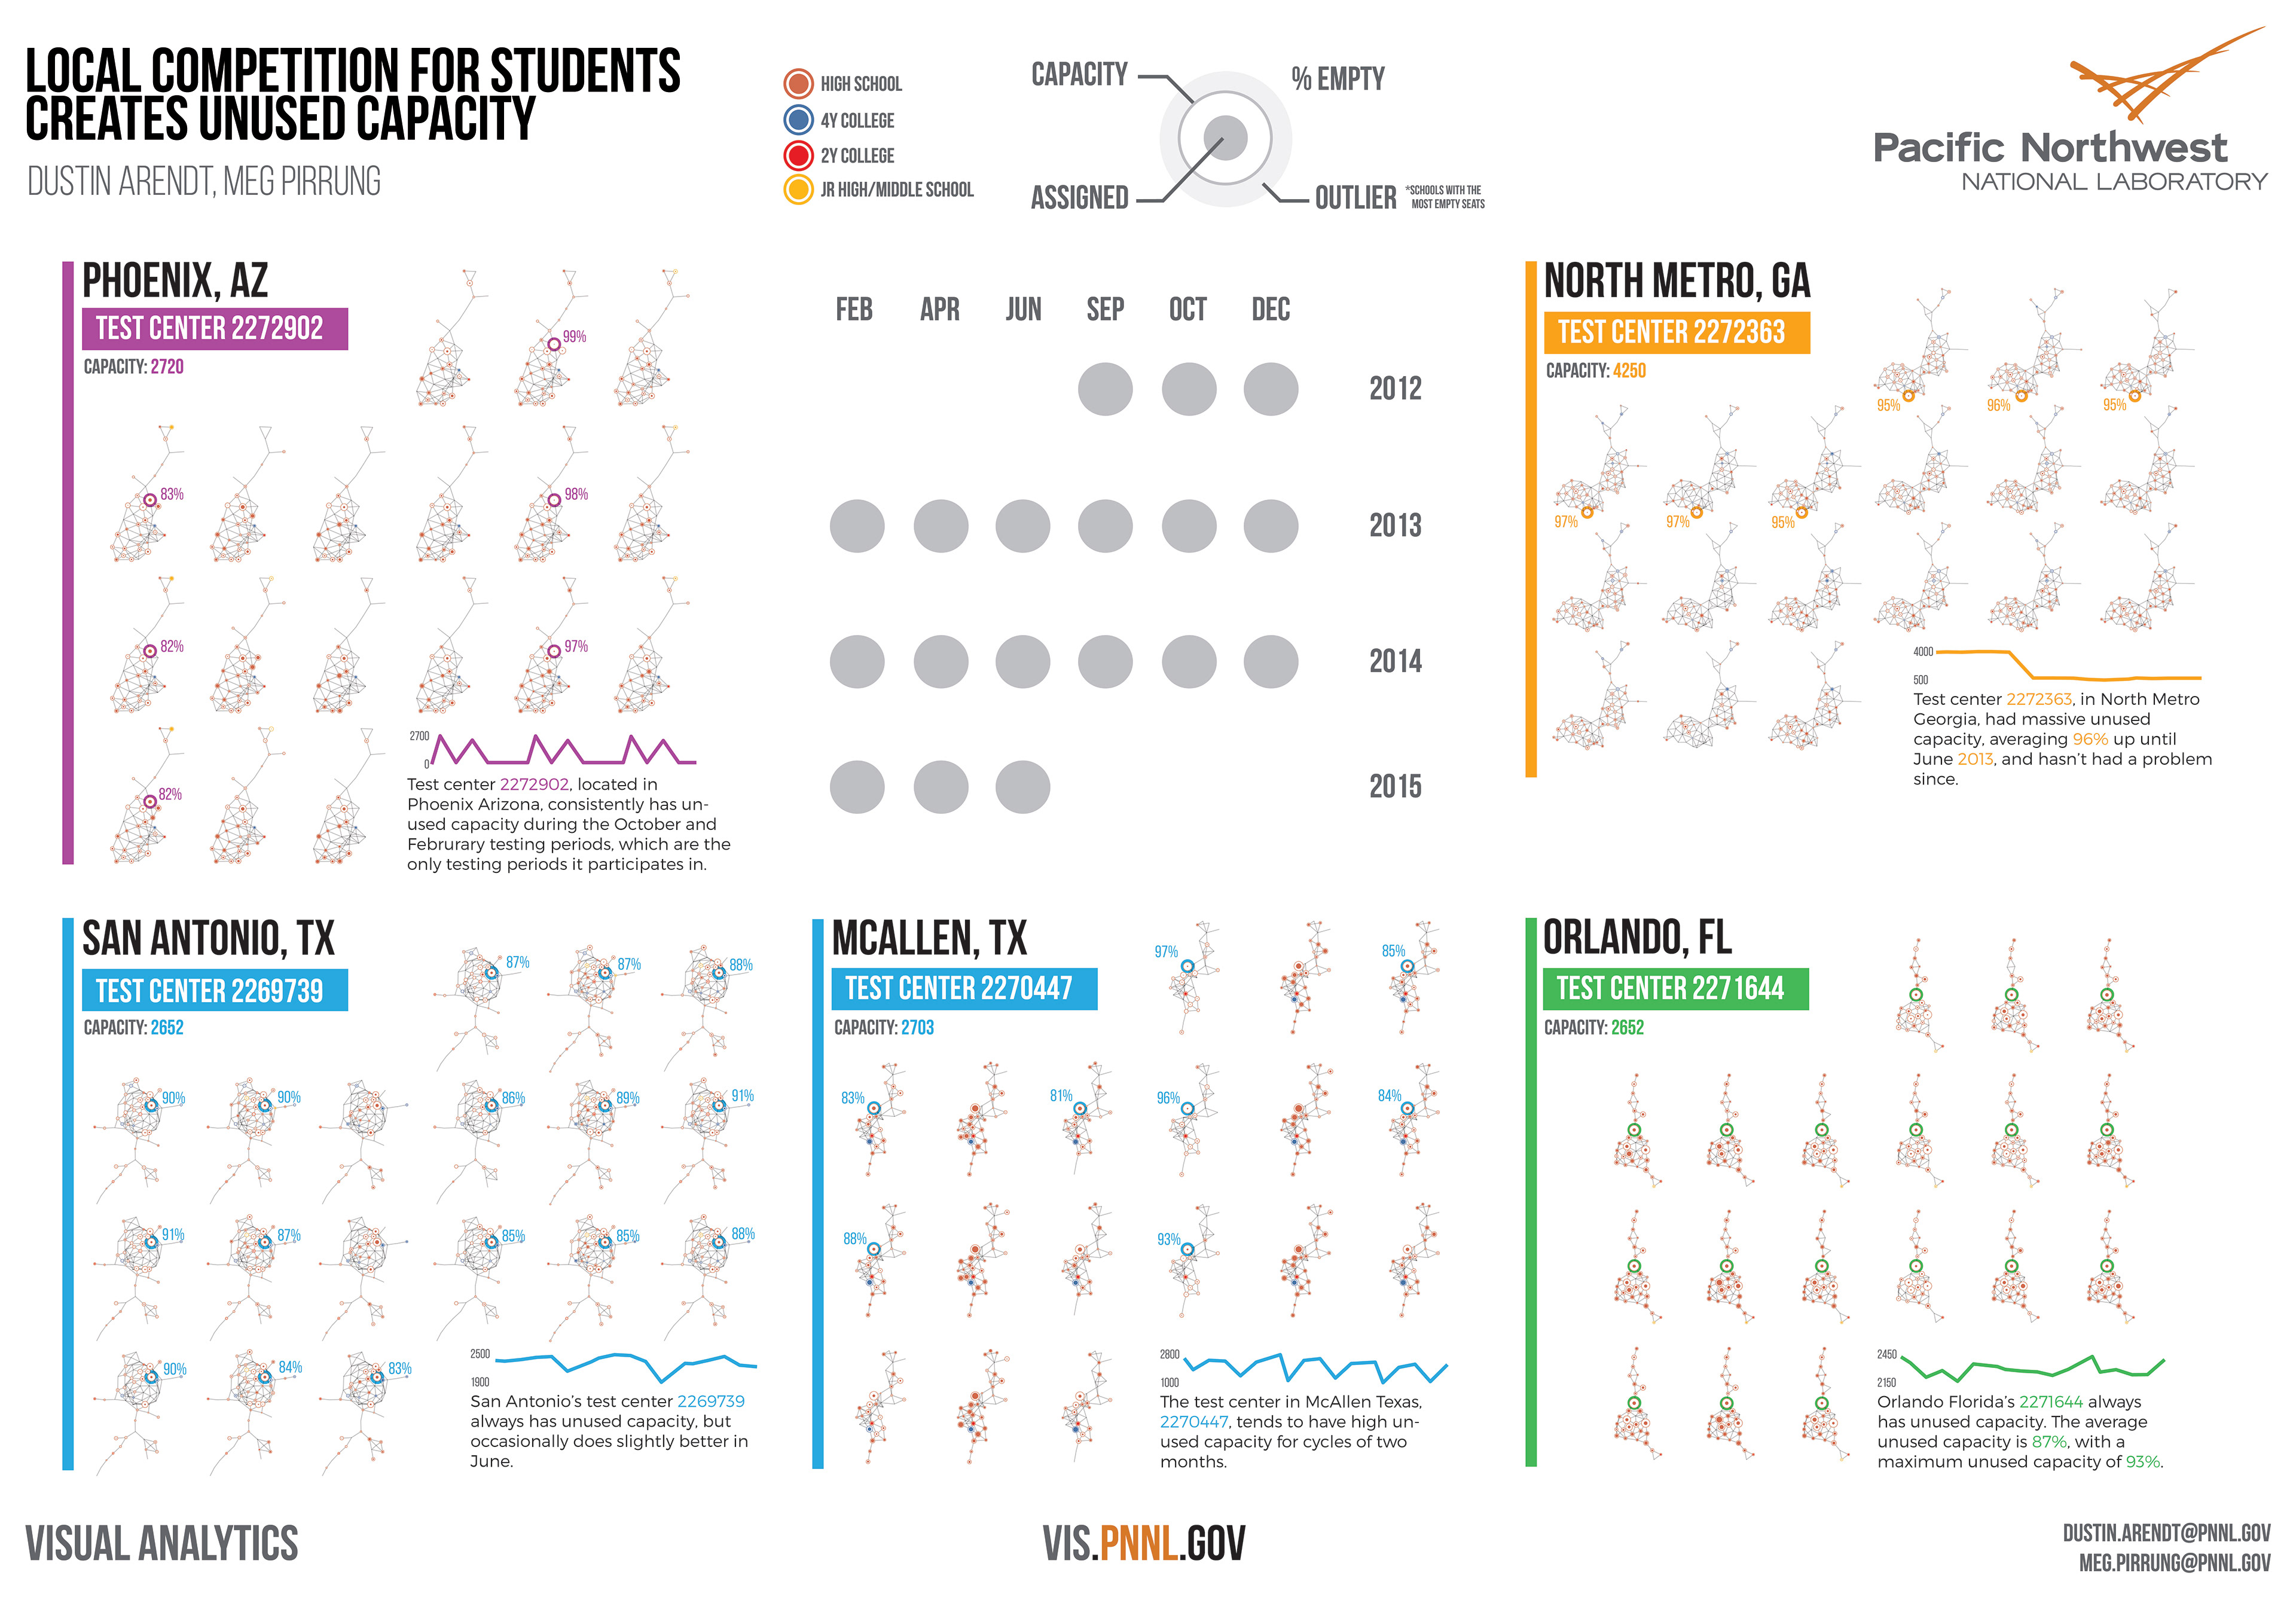
winning poster /